VOLUME 1, NUMBER 1 | SPRING 1998
|
| ||
|
Improving Inventory Performance and BOTTOM-LINE PROFITS By Gary Gossard | ||
Even the most comprehensive manufacturing planning and distribution management systems have yielded disappointing results in controlling inventory dollars. The traditional measure of inventory performance -- Inventory Turns -- does not adequately serve materials managers nor financial managers. Competitive companies need a more effective means to measure inventory performance and to control inventory investment.
New methods of measuring and managing inventory performance have been successful in reducing inventories 20-40 percent. These methods actually increase the effectiveness of material planners, buyers and schedulers, and have improved the understanding and cooperation required among manufacturing, sales, engineering and finance to reduce excess inventories and increase bottom-line profits. This article is about a new way to measure inventory performance and about putting a dollar focus on inventory management priorities. It reviews the financial impact of inventories and shows how the information from any MRP, MRP II, DRP, ERP or order-point system can be used for setting individual objectives for inventory reduction, measuring performance by inventory segment and monitoring continuous improvement.
| Financial Impact of Inventories |
First, when a company spends money to purchase excess inventory it has a negative impact on cash flow. (Excess inventory is defined as on-hand balances in excess of the amount needed to support demand.) Reducing inventory levels by deferring purchases until the materials are needed will immediately improve your cash flow.
Second, we have the cost of carrying the inventory. I am not talking about the total carrying cost including the warehouse, the racks and shelving � let us consider that fixed for the near term. I am talking about the truly variable cost of carrying extra inventory: the interest cost and the insurance premiums. In today's market that is anywhere between 8-14 percent, and rising. Depending on your financing costs, reducing the level of purchased inventories will typically put 10 percent of the reduction to the bottom line. Reducing the levels of manufactured inventories -- consistent with demand � will have an even greater impact.
Yet another factor contributing to the bottom line of the company are the financial reserves. The accountants and auditors require that a company set aside money that would otherwise be considered profits to allow for inventories that may no longer be worth their original cost. This is not just a reserve for obsolete inventories, but also for slow moving and excess inventories that may become obsolete in the future. Financial reserves are a dollar-for-dollar reduction in net profits. Inventory reserves and writeoffs can easily exceed inventory carrying costs in impacting the bottom line.
So, buying and carrying excess inventory is sort of like triple jeopardy: You reduce your cash or credit line to buy it; then you pay interest and insurance expense to carry it; and, if it becomes slow moving or obsolete, it will further reduce your profits with financial reserves and possible write-offs. Keeping inventory levels as low as possible, consistent with meeting demand, is a vital way that inventory managers can have a significant impact on the bottom-line profits of their companies.
| Need for a Dollar Focus |
I know that none of you have ever had a production schedule revised or had an engineering change hit your bill of materials (Ha!). But if that were to happen, how do we sort out our priorities for inventory management? When the action advice report goes from 10 to 100 pages and there is not enough time to work even half of the problems before the next report hits your desk -- how do we know which exceptions should be addressed first? Which will have the biggest impact on the bottom line?
To be able to answer these and other questions, we should shift our focus from looking at quantities to looking at dollars. How many dollars of open purchase orders and work orders are still outstanding for parts that may never be used? How many dollars are already tied up in excess inventories? What is my inventory reduction potential? After all, have you ever heard a CEO or a CFO say, "We have too many parts in the storeroom"? It is much more likely that they have said, "We have too many dollars tied up in inventory." Since top management measures inventory performance in dollars, shouldn't we be doing the same?
Putting a dollar focus on inventory issues is more than just sorting exception reports by dollars -- although that, in itself, would help some companies. A true dollar-based performance measure involves: (1) establishing inventory classes based on future dollar requirements, (2) setting target inventory levels for the various classes of inventory, and (3) measuring the dollars invested in good, bad and marginal inventories. Using this methodology to actually improve the bottom line also requires: (4) setting specific objectives for inventory reduction, (5) analyzing the data in poor quality categories to identify the best opportunities, and (6) using the performance measure to monitor continuous improvement over time.
| The Inventory Quality Ratio |
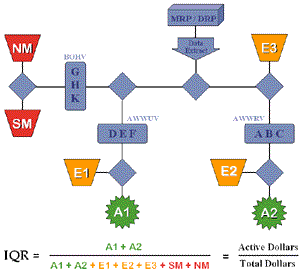
| Figure1 describes one methodology for putting a dollar focus on inventory management priorities and for measuring true inventory performance. This method is called the Inventory Quality Ratio (IQR). |
 |
It was developed collectively by the materials managers of 35 companies and was used by them to reduce inventories $500 million in two years while improving on-time deliveries. It has since been used successfully by planners and buyers in other manufacturing and distribution companies to reduce inventories an average of 25 percent.
To summarize, the IQR logic first divides inventory into three groups: items with future requirements, items with no future requirements but with recent past usage, and items with neither. The items in these groups are then stratified into typical ABC-type classifications using their future dollar requirements, their past dollar usage, or their current balances on hand, respectively. A rule or target inventory level is set for each item based on its classification. The balance on hand of each item is compared to the rule and the dollars of each item are categorized as either active (A1 or A2), excess (E1, E2 or E3), slow moving (SM) or no moving (NM). These are called the seven quality categories.
The IQR is the ratio of active inventory dollars to total inventory dollars. In a theoretically perfect situation (i.e., with no excess, slow moving or no moving inventories), the IQR would be 100 percent. Using nominal target inventory levels of 4-12-24 weeks' supply for A-B-C items, respectively, the IQR for most companies we have surveyed is in the 30-45 percent range. This means that approximately two-thirds of their inventory dollars are tied up in excess, slow or no moving items. Further, we have found that slow and no moving inventories account for about 10 percent of the dollars and one category, Excess 2 (E2), accounts for 30-50 percent of their total inventory dollars.
All of these companies are running MRP, MRP II or ERP software, and many are employing JIT principles, APICS-certified planners and NAPM-certified buyers. Well-educated people using the latest tools still find it difficult to control inventory dollars. It has been interesting to note that companies with higher IQRs in the 50-70 percent range have been the ones most attracted to further improving their inventory performance -- something about good companies wanting to do better.
One well-known company started using IQR when it was already turning raw materials 30 times per year. It changed the performance parameters from 4-12-24 weeks to a much more aggressive 1-2-6 weeks, which lowered its IQR and created new targets to pursue. This methodology helped the company increase raw material turns to 40 times per year. Whatever a company's current inventory performance may be, there are usually improvements that can be made by focusing on the dollars. The IQR methodology lets each planner or company set the performance parameters to match their specific situation and to change them over time.
Although inventory turns is widely used as a measure of inventory performance, the calculation typically lumps all of the inventory together and often hides the slow movers. The methodology described herein examines every item in the inventory, compares it to dynamic target levels based on future requirements or past usage, and prioritizes the exceptions based on the dollar impact. IQR measures performance by inventory segment and provides information for managing inventory dollars by planner, product line, commodity code, location, etc.
| Interactive Demonstration |
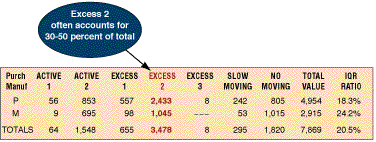
Figure 2 provides a top-down look by the various quality categories of the purchased and manufactured inventories in thousands of dollars.
![]()

![]()
Here the total inventory is $7.8 million, and the IQR is 20.5 percent (lots of room for improvement). If the planners are concerned about the $2.4 million of excess purchased parts, they can drill down on that cell and see all of the part numbers sorted by the dollar amount of excess inventory. The planners can also drill down on any item and see all of the detailed information for a given part number. Different views of inventory investment, similar to the make/buy breakdown in Exhibit 2, are also available by product line, planner, commodity code, ABC classification, storeroom and plant location.
In addition to measuring inventory performance, an underlying objective of IQR is to avoid the buildup of excess inventories that may become slow moving and no moving and eventually be written off. To that end, it identifies open orders for items where the on-hand balance is already greater than the target inventory level and prioritizes them by the dollars involved. The program can also identify potential shortages where the balance on hand is less than the rule and there are no open orders.
The current Inventory Profile can be used to simulate the impact of different material ordering guidelines on the inventory balances. Different scenarios in terms of safety stocks and ordering cycles can be evaluated off-line without the danger of changing current MRP settings. This can be a useful tool for setting realistic inventory reduction objectives.
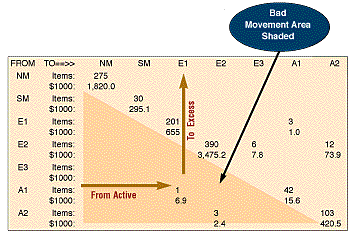
There are many causes for the formation of excess inventory. Only a few of these are under the control of the materials department. Most are the result of engineering changes, poor sales forecasts or production problems. The Inventory Movement Matrix (Figure 3) is a from-to chart that reports when an item of inventory has changed quality categories.
![]()

This is used by the planner to identify good and bad movement and to help determine the root causes of inventory buildup. When management has the facts and figures about the real reasons for bad inventory, they are more likely to take corrective action.
Other reports have been developed using the basic data required to track inventory performance. Such programs do the detailed analysis and leave you with more time to work the problems. Perhaps one of the greatest benefits of a dollar focus is showing planners and managers exactly where they can have the greatest impact on inventory performance and company profits. Many users have expressed greater confidence and satisfaction in knowing that they are working on the most important issues.
| Inventory Reduction Results |
Reviewing individual data provided some insights as to how and why they were so successful. The planners and buyers formed teams in the spirit of friendly competition. Since the teams were responsible for different commodity codes and product groups, they had inherently different potentials for inventory reduction. Some teams were able to achieve a 60 percent reduction while others only 5 percent or 7 percent. Had management issued an edict that there would be a 20 percent reduction in inventories, I doubt they would have been as successful. Some teams would have hurt service levels with a 20 percent reduction, while others would likely have achieved the 20 percent objective rather easily and gone back to business as usual, never realizing their full potential of 60 percent reduction.
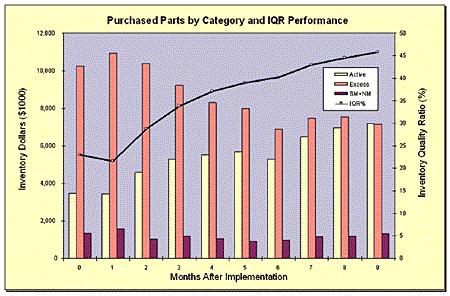
As shown in Figure 4, another high-tech company doubled their IQR for purchased parts from a baseline of 23 to 46 percent in nine months.
![]()

![]()
A major and tangible benefit was a $3.8 million (35 percent) reduction in excess inventories. This company had been using the latest, state-of-the-art, closed-loop, integrated MRP II system. They had implemented make-to-order for final assembly, kanban method of Just-In-Time for sub-assemblies, and event-driven replenishment for purchased components. But their overall inventory investment and obsolescence exposure were increasing while their turns were decreasing. The dollar focus provided by IQR proved to be the key to gaining control of their inventories.
As with most performance measurement and management tools, the initial values are relatively unimportant and should not be compared to one another. What is important is for each planner to set target inventory levels and goals that reflect their individual reduction potential and then monitor continuous improvement over time-What is your IQR now and what will it be six months from now?
| Conclusion |
We need to provide appropriate incentives for keeping inventory levels down. Performance bonuses have been used and can offer a very attractive return on investment . In most cases, however, straightforward communication of appropriate reduction goals and management recognition of accomplishments are sufficient to make significant improvements.
The technique and tools are available to set meaningful inventory reduction targets, to prioritize opportunities for improvement, to make the planner's job easier, to measure and track inventory performance, and to express results in terms of company profits. What better way for materials management to dollarize their results and demonstrate the importance of their contributions to the bottom line?
This article is based on a presentation made at the APICS 39th International Conference and another presentation scheduled for the National Manufacturing Week Conference '98.
| ABOUT THE AUTHOR |
 Gary Gossard is president of IQR International, a Los Angeles-based company providing management tools to the manufacturing and distribution industries. Prior to joining IQR International in 1992, Gossard was the chief operating officer of a high-technology manufacturing company where he had overall responsibility for planning, procurement, manufacturing and finance. His previous experience also includes Partner in a "Big 6" CPA firm where he specialized in the operations and profit improvement of manufacturing companies. Gossard is a graduate of the USC School of Engineering and the Stanford Executive Management Program. He is a Registered Professional Engineer and a frequent speaker at APICS, NAPM and manufacturing industry conferences.
|
Web Site © Copyright 2020 by Lionheart Publishing, Inc.
All rights reserved.
Lionheart Publishing, Inc.
2555 Cumberland Parkway, Suite 299, Atlanta, GA 30339 USA
Phone: +44 23 8110 3411 |
E-mail:
Web: www.lionheartpub.com
Web Design by Premier Web Designs
E-mail: [email protected]